Vaizdas:U.S. Home Ownership and Subprime Origination Share.png

Didesnės raiškos iliustracija (960 × 720 taškų, rinkmenos dydis: 29 KiB, MIME tipas: image/png)
| Ši byla yra iš bendros Wikimedia Commons nemokamų resursų duomenų bazės, palaikomos Wikimedia Foundation organizacijos. Norėdami sužinoti licencijavimo smulkmenas, žiūrėkite paveikslėlio aprašymą |  |
Į paveikslėlio aprašymą |
Aprašymas

|
Šis paveikslėlis graph (arba visos šio straipsnio iliustracijos) turėtų būti iš naujo sukurtas naudojant vektorinę grafiką, kaip, pavyzdžiui, SVG failas. To privalumus ir daugiau informacijos rasite straipsnyje Commons:Media for cleanup. Jei šio failo SVG versija jau sukurta, prašome ją įkelti. Po įkėlimo šios iliustracijos puslapyje pakeiskite šį šabloną į {{vector version available|naujas paveikslėlio pavadinimas.svg}}.
|
| Aprašymas |
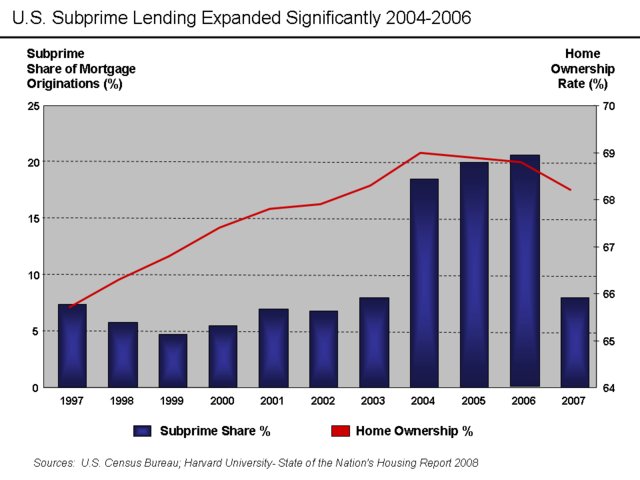
English: There are various mortgage categories defined based on the credit quality of the borrower. These include subprime, Alt-A, and Prime. The share of subprime mortgages is shown in the diagram. It is the ratio of the dollar value of subprime mortgages to all originations, expressed as a percentage. The level of home ownership is based on the percentage of American households that own homes rather than rent.
Subprime mortgages remained below 10% of all mortgage originations until 2004, when they spiked to nearly 20% and remained there through the 2005-2006 peak of the housing bubble.[1] A proximate event to this increase was the April 2004 decision by the SEC to relax the net capital rule, which encouraged the largest five investment banks to dramatically increase their financial leverage and aggressively expand their issuance of mortgage-backed securities. This applied additional competitive pressure to Fannie Mae and Freddie Mac, which further expanded their riskier lending.[2] Excerpts from the Harvard Report:
Other interpretations:
Source Data |
| Data | m. gegužės 30 d. (pirminio įkėlimo data) |
| Šaltinis | Perkelta iš en.wikipedia į Vikiteką. |
| Autorius | Farcaster iš anglų kalbos Vikipedija |
Licencija
- Jūs galite:
- dalintis – kopijuoti, platinti bei persiųsti šį darbą
- pri(si)taikyti – adaptuoti darbą
- Su šiomis sąlygomis:
- autoriaus nurodymas – Turite pateikti atitinkamą kreditą, pateikti nuorodą į licenciją ir nurodyti, ar buvo atlikti pakeitimai. Tai galite padaryti bet kokiu būdu, bet ne taip, kad licencijos išdavėjas patvirtintų jus ar jūsų naudojimą.
- dalinkis panašiai – Jei perdirbsite, redaguosite ar atkursite šį darbą, jį galėsite platinti tik su tokia pačia ar panašia į šią licencija.

|
Suteikiamas leidimas kopijuoti, platinti ir/ar redaguoti šį dokumentą pagal GNU Free Documentation licencijos versijos 1.2 ar bet kurios vėlesnės versijos sąlygas, publikuotas Free Software Foundation; be nekintamų dalių, be priekinių ir galinių tekstinių žymų viršeliuose. Šios licencijos kopija įtraukta dalyje, pavadintoje GNU Free Documentation License. |
Originalus įkėlimo įrašas
- 2009-05-30 23:44 Farcaster 960×720× (30085 bytes)
- 2009-05-30 23:16 Farcaster 960×720× (28829 bytes) {{Information |Description = Subprime mortgage share as % originations and home ownership rate |Source = [http://www.jchs.harvard.edu/publications/markets/son2008/son2008.pdf Harvard 2008 State of Nation's Housing Report] |Date = M
Rinkmenos istorija
Paspauskite ant datos/laiko, kad pamatytumėte rinkmeną tokią, kokia ji buvo tuo metu.
| Data/Laikas | Miniatiūra | Matmenys | Naudotojas | Paaiškinimas | |
|---|---|---|---|---|---|
| dabartinis | 03:57, 14 spalio 2010 | | 960 × 720 (29 KiB) | Hideokun | {{Information |Description={{en|There are various mortgage categories defined based on the credit quality of the borrower. These include subprime, Alt-A, and Prime. The share of subprime mortgages is shown in the diagram. It is the ratio of the dollar va |
Paveikslėlio naudojimas
Paveikslėlis yra naudojamas šiuose puslapiuose:
Visuotinis rinkmenos naudojimas
Ši rinkmena naudojama šiose viki svetainėse:
- Naudojama de.wikipedia.org
- Naudojama el.wikipedia.org
- Naudojama en.wikipedia.org
- Naudojama fr.wikipedia.org
- Naudojama gu.wikipedia.org
- Naudojama hi.wikipedia.org
- Naudojama hy.wikipedia.org
- Naudojama it.wikipedia.org
- Naudojama ja.wikipedia.org
- Naudojama kn.wikipedia.org
- Naudojama ta.wikipedia.org