Vaizdas:Okuns law quarterly differences.svg

Rinkmenos SVG peržiūros PNG dydisː 301 × 199 taškų. Kitos 5 rezoliucijos: 320 × 212 taškų | 640 × 423 taškų | 1 024 × 677 taškų | 1 280 × 846 taškų | 2 560 × 1 692 taškų.
Didesnės raiškos iliustracija (SVG rinkmena, formaliai 301 × 199 taškų, rinkmenos dydis: 90 KiB)
| Ši byla yra iš bendros Wikimedia Commons nemokamų resursų duomenų bazės, palaikomos Wikimedia Foundation organizacijos. Norėdami sužinoti licencijavimo smulkmenas, žiūrėkite paveikslėlio aprašymą |  |
Į paveikslėlio aprašymą |
Aprašymas
| Aprašymas |
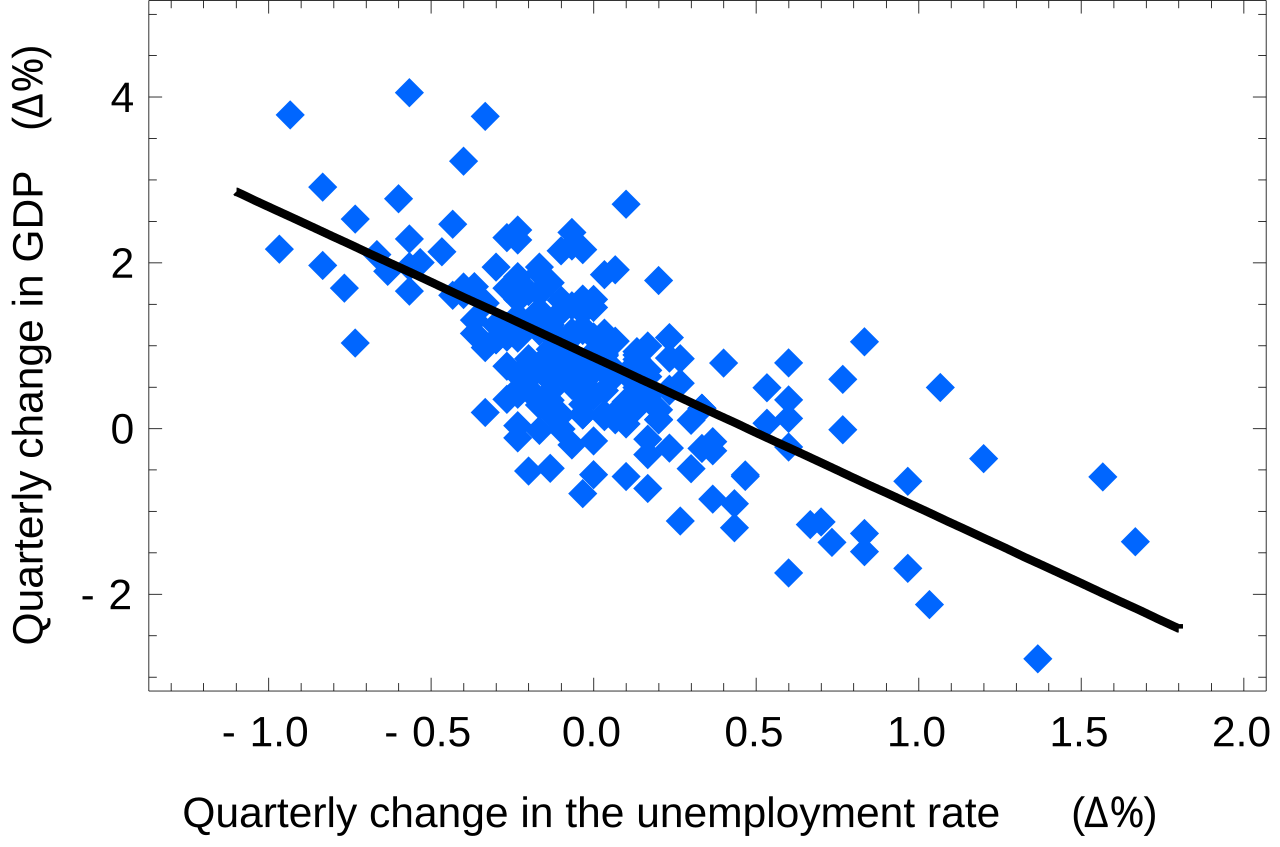
English: Okun's law: the relationship between the GDP growth and change in unemployment is approximately linear. This data set shows the law in application to US quarterly data, taken from http://economics.about.com/cs/datasources/a/quarterlydata.htm |
| Šaltinis | Mano darbas |
| Autorius | Stpasha |
| Kitos versijos | File:Okuns law charter quarter.JPG |
Source code (R - r-project.org )
#R OS language and environment www.r-project.org

#Load and show regressand manually
(gdpch =c(1.5671,0.4097,0.1913,-1.4000,-0.2775,1.1326,-1.0303,4.1384,2.9991,3.8703,1.7934,1.1175,1.7028,
2.0014,0.1902,1.1610,0.0804,0.6323,3.3120,1.8452,0.8198,-0.6375,-1.6014,-0.4980,0.1496,1.0819,1.9827,2.8587,
1.5986,1.3343,0.5286,-0.4272,0.7874,-0.1123,1.6438,0.5667,-0.2291,0.9735,-1.0414,-2.6930,0.5809,2.2444,
2.2503,2.0885,2.6133,-0.0429,0.3303,2.2188,-0.4935,0.1849,-1.2880,0.5780,1.8720,1.6426,2.0405,1.7437,1.0810,
0.9839,0.2503,1.1831,1.3022,1.9188,0.7280,2.2304,1.1891,1.3480,0.2611,2.4518,1.3491,2.0335,2.3896,2.4811,
0.3780,0.6349,0.8721,0.9197,-0.0638,0.7235,0.7485,2.0340,1.7204,0.7042,0.4270,1.5468,0.2614,0.5802,-0.4710,
-0.1372,0.2075,0.8758,-1.0734,2.7927,0.5483,0.7677,0.2504,1.9630,2.2887,0.9913,1.7388,2.5511,1.0019,-0.3944,
0.8283,-0.7661,0.2695,-1.1113,-0.5509,-1.2802,0.8778,1.7354,1.2587,2.3733,0.8298,0.4743,0.8214,1.2186,
1.7980,1.7996,0.1203,0.2797,3.8528,0.9652,1.3363,0.2523,0.0634,0.7115,0.3329,0.3298,-2.0388,-0.1544,1.7793,
1.9426,-0.6995,1.1906,-1.1806,-1.6570,0.4314,-0.4741,0.0713,1.1555,2.3610,1.7800,2.0539,2.1847,1.6937,
0.8646,0.7543,0.8347,0.7833,1.4946,0.8231,0.9111,0.4165,0.9281,0.5322,0.7337,1.0626,0.8376,1.7346,0.6657,
1.1775,0.5118,1.2989,1.2157,0.5440,0.4742,0.3464,1.2482,0.2293,-0.1827,-0.8215,-0.4922,0.5595,0.2459,0.5385,
0.9284,0.9361,0.7726,1.3174,-0.0272,0.6081,0.4380,1.5109,0.8467,1.3943,0.5457,1.2333,0.3699,0.1950,0.7743,
0.8001,0.7150,1.6479,0.4998,1.1400,1.0730,1.4408,1.0416,0.6852,1.4916,0.5550,1.0139,1.6345,0.7534,0.4844,
1.2694,1.7239,0.6338,1.1905,0.1412,0.2723,-0.1504,-0.3987,-0.0729,0.6793,1.2369,0.3119,0.9923,0.3437))

#Load and show regressor manually
(unempch =c(-0.066666667,0.1,0.066666667,0.833333333,1.2,0.833333333,0.266666667,-0.566666667,-0.833333333,
-0.933333333,-0.4,-0.733333333,-0.4,0.066666667,0.2,-0.3,-0.1,0.266666667,-0.4,-0.133333333,-0.133333333,
0.166666667,0.966666667,1.566666667,0.533333333,0.166666667,-0.633333333,-0.6,-0.333333333,-0.3,0.133333333,
-0.2,0.166666667,-0.066666667,0,-0.2,0.166666667,0.133333333,0.7,1.366666667,1.066666667,-0.033333333,
-0.966666667,-0.533333333,-0.733333333,0.166666667,0.333333333,-0.466666667,0.1,0.3,0.733333333,0.533333333,
0.2,-0.233333333,-0.566666667,-0.566666667,-0.1,0.033333333,-0.033333333,0.233333333,-0.033333333,
-0.233333333,0.066666667,-0.1,-0.266666667,-0.2,-0.033333333,-0.066666667,-0.233333333,-0.3,-0.266666667,
-0.233333333,-0.033333333,-0.066666667,-0.066666667,0.133333333,0,-0.033333333,0.1,-0.166666667,
-0.166666667,-0.033333333,-0.133333333,0,0.033333333,0.133333333,0,0.6,0.6,0.4,0.666666667,0.1,-0.033333333,
0.133333333,-0.1,-0.166666667,-0.066666667,-0.133333333,-0.2,-0.433333333,0,-0.133333333,-0.033333333,
0.366666667,0.066666667,0.433333333,0.966666667,1.666666667,0.6,-0.4,-0.166666667,-0.566666667,-0.166666667,
0.166666667,0.033333333,-0.266666667,-0.366666667,-0.233333333,-0.233333333,-0.333333333,-0.333333333,
0.033333333,-0.133333333,-0.033333333,-0.166666667,0.166666667,0.1,0.333333333,1.033333333,0.333333333,
-0.266666667,0.033333333,-0.033333333,0,0.833333333,0.6,0.6,0.466666667,0.766666667,-0.3,-0.233333333,
-0.766666667,-0.833333333,-0.666666667,-0.433333333,0,-0.133333333,-0.066666667,0.066666667,-0.1,
-0.166666667,0,0.133333333,-0.2,-0.133333333,-0.233333333,-0.333333333,-0.266666667,-0.166666667,
-0.133333333,-0.233333333,0,-0.133333333,-0.133333333,0.033333333,0,0.133333333,-0.066666667,0.033333333,
0.366666667,0.433333333,0.466666667,0.233333333,0.033333333,0.233333333,0.266666667,0.233333333,0.033333333,
-0.266666667,-0.233333333,-0.066666667,-0.266666667,-0.166666667,-0.066666667,-0.366666667,-0.2,
-0.366666667,-0.166666667,0.2,0,-0.1,-0.033333333,-0.033333333,-0.233333333,0.066666667,-0.1,-0.233333333,
-0.133333333,-0.2,-0.033333333,-0.233333333,0.133333333,-0.1,-0.133333333,-0.033333333,-0.033333333,
-0.166666667,-0.033333333,-0.066666667,0.1,-0.133333333,0.233333333,0.3,0.366666667,0.766666667,0.033333333,
0.2,-0.066666667,0.133333333))

#Plot data without symbols in labels
plot(unempch, gdpch,
   main = "Okun’s law",
   xlab = "Quarterly change in unemployment rate",
   ylab = "Quarterly change in GDP "
)

#Plot data with symbols in labels
plot(unempch, gdpch,
   main = "Okun’s law",
   xlab = expression("Quarterly change in unemployment rate (" *Delta* "%)" ),
   ylab = expression("Quarterly change in GDP (  " *Delta* "%)")
)

#Draw regression line based on linear model
abline(lm(gdpch ~ unempch), col="red")
Source code (Mathematica)
gdpch = {1.5671,0.4097,0.1913,-1.4000,-0.2775,1.1326,-1.0303,4.1384,2.9991,3.8703,1.7934,1.1175,1.7028,2.0014,0.1902,1.1610,0.0804,0.6323,3.3120,1.8452,0.8198,-0.6375,-1.6014,-0.4980,0.1496,1.0819,1.9827,2.8587,1.5986,1.3343,0.5286,-0.4272,0.7874,-0.1123,1.6438,0.5667,-0.2291,0.9735,-1.0414,-2.6930,0.5809,2.2444,2.2503,2.0885,2.6133,-0.0429,0.3303,2.2188,-0.4935,0.1849,-1.2880,0.5780,1.8720,1.6426,2.0405,1.7437,1.0810,0.9839,0.2503,1.1831,1.3022,1.9188,0.7280,2.2304,1.1891,1.3480,0.2611,2.4518,1.3491,2.0335,2.3896,2.4811,0.3780,0.6349,0.8721,0.9197,-0.0638,0.7235,0.7485,2.0340,1.7204,0.7042,0.4270,1.5468,0.2614,0.5802,-0.4710,-0.1372,0.2075,0.8758,-1.0734,2.7927,0.5483,0.7677,0.2504,1.9630,2.2887,0.9913,1.7388,2.5511,1.0019,-0.3944,0.8283,-0.7661,0.2695,-1.1113,-0.5509,-1.2802,0.8778,1.7354,1.2587,2.3733,0.8298,0.4743,0.8214,1.2186,1.7980,1.7996,0.1203,0.2797,3.8528,0.9652,1.3363,0.2523,0.0634,0.7115,0.3329,0.3298,-2.0388,-0.1544,1.7793,1.9426,-0.6995,1.1906,-1.1806,-1.6570,0.4314,-0.4741,0.0713,1.1555,2.3610,1.7800,2.0539,2.1847,1.6937,0.8646,0.7543,0.8347,0.7833,1.4946,0.8231,0.9111,0.4165,0.9281,0.5322,0.7337,1.0626,0.8376,1.7346,0.6657,1.1775,0.5118,1.2989,1.2157,0.5440,0.4742,0.3464,1.2482,0.2293,-0.1827,-0.8215,-0.4922,0.5595,0.2459,0.5385,0.9284,0.9361,0.7726,1.3174,-0.0272,0.6081,0.4380,1.5109,0.8467,1.3943,0.5457,1.2333,0.3699,0.1950,0.7743,0.8001,0.7150,1.6479,0.4998,1.1400,1.0730,1.4408,1.0416,0.6852,1.4916,0.5550,1.0139,1.6345,0.7534,0.4844,1.2694,1.7239,0.6338,1.1905,0.1412,0.2723,-0.1504,-0.3987,-0.0729,0.6793,1.2369,0.3119,0.9923,0.3437};
unempch = {-0.066666667,0.1,0.066666667,0.833333333,1.2,0.833333333,0.266666667,-0.566666667,-0.833333333,-0.933333333,-0.4,-0.733333333,-0.4,0.066666667,0.2,-0.3,-0.1,0.266666667,-0.4,-0.133333333,-0.133333333,0.166666667,0.966666667,1.566666667,0.533333333,0.166666667,-0.633333333,-0.6,-0.333333333,-0.3,0.133333333,-0.2,0.166666667,-0.066666667,0,-0.2,0.166666667,0.133333333,0.7,1.366666667,1.066666667,-0.033333333,-0.966666667,-0.533333333,-0.733333333,0.166666667,0.333333333,-0.466666667,0.1,0.3,0.733333333,0.533333333,0.2,-0.233333333,-0.566666667,-0.566666667,-0.1,0.033333333,-0.033333333,0.233333333,-0.033333333,-0.233333333,0.066666667,-0.1,-0.266666667,-0.2,-0.033333333,-0.066666667,-0.233333333,-0.3,-0.266666667,-0.233333333,-0.033333333,-0.066666667,-0.066666667,0.133333333,0,-0.033333333,0.1,-0.166666667,-0.166666667,-0.033333333,-0.133333333,0,0.033333333,0.133333333,0,0.6,0.6,0.4,0.666666667,0.1,-0.033333333,0.133333333,-0.1,-0.166666667,-0.066666667,-0.133333333,-0.2,-0.433333333,0,-0.133333333,-0.033333333,0.366666667,0.066666667,0.433333333,0.966666667,1.666666667,0.6,-0.4,-0.166666667,-0.566666667,-0.166666667,0.166666667,0.033333333,-0.266666667,-0.366666667,-0.233333333,-0.233333333,-0.333333333,-0.333333333,0.033333333,-0.133333333,-0.033333333,-0.166666667,0.166666667,0.1,0.333333333,1.033333333,0.333333333,-0.266666667,0.033333333,-0.033333333,0,0.833333333,0.6,0.6,0.466666667,0.766666667,-0.3,-0.233333333,-0.766666667,-0.833333333,-0.666666667,-0.433333333,0,-0.133333333,-0.066666667,0.066666667,-0.1,-0.166666667,0,0.133333333,-0.2,-0.133333333,-0.233333333,-0.333333333,-0.266666667,-0.166666667,-0.133333333,-0.233333333,0,-0.133333333,-0.133333333,0.033333333,0,0.133333333,-0.066666667,0.033333333,0.366666667,0.433333333,0.466666667,0.233333333,0.033333333,0.233333333,0.266666667,0.233333333,0.033333333,-0.266666667,-0.233333333,-0.066666667,-0.266666667,-0.166666667,-0.066666667,-0.366666667,-0.2,-0.366666667,-0.166666667,0.2,0,-0.1,-0.033333333,-0.033333333,-0.233333333,0.066666667,-0.1,-0.233333333,-0.133333333,-0.2,-0.033333333,-0.233333333,0.133333333,-0.1,-0.133333333,-0.033333333,-0.033333333,-0.166666667,-0.033333333,-0.066666667,0.1,-0.133333333,0.233333333,0.3,0.366666667,0.766666667,0.033333333,0.2,-0.066666667,0.133333333};
data = Table[{unempch[[i]], gdpch[[i]]}, {i, Length[unempch]}];
reg = FindFit[data, a + b x, {a, b}, x]
Show[
  ListPlot[{{{-10, 0}}, {{-10, 0}}, data}, PlotMarkers->{Automatic, Small}, PlotStyle->Hue[0.6]],
  Plot[ (a + b x) /. sol, {x, -1.1, 1.8}, PlotStyle->{GrayLevel[0], Thick}],
  PlotRange -> {{-1.3, 2}, {-3, 5}},
  Axes -> False,
  Frame -> True,
  FrameLabel -> {"Quarterly change in unemployment rate (\[CapitalDelta]%)", "Quarterly change in GDP (\[CapitalDelta]%)"},
  FrameStyle -> Directive[FontFamily -> "Arial"]
]
Licencija
| Aš, šio darbo autorinių teisių savininkas, šį darbą skelbiu viešo naudojimo. Tai galioja visame pasaulyje. Kai kuriose šalyse tai negali būti legaliai leidžiama; jei taip: Suteikiu teisę naudoti šį darbą bet kokiai paskirčiai, be jokių sąlygų, nebent jos reikalaujamos įstatymų. |
Rinkmenos istorija
Paspauskite ant datos/laiko, kad pamatytumėte rinkmeną tokią, kokia ji buvo tuo metu.
| Data/Laikas | Miniatiūra | Matmenys | Naudotojas | Paaiškinimas | |
|---|---|---|---|---|---|
| dabartinis | 00:42, 26 liepos 2009 | | 301 × 199 (90 KiB) | Stpasha | + "the" >.> |
| 00:23, 26 liepos 2009 |  | 301 × 199 (91 KiB) | Stpasha | Fixed parentheses | |
| 00:19, 26 liepos 2009 |  | 301 × 199 (91 KiB) | Stpasha | {{Information |Description={{en|1=Okun's law: the relationship between the GDP growth and change in unemployment is approximately linear. This data set shows the law in application to US quarterly data, taken from http://economics.about.com/cs/datasources |
Paveikslėlio naudojimas
Paveikslėlis yra naudojamas šiuose puslapiuose:
Visuotinis rinkmenos naudojimas
Ši rinkmena naudojama šiose viki svetainėse:
- Naudojama ar.wikipedia.org
- Naudojama en.wikipedia.org
- Unemployment
- Coefficient of determination
- Ordinary least squares
- Simple linear regression
- Econometric Theory
- Journal of Business & Economic Statistics
- Applied Econometrics and International Development
- Line chart
- Journal of Econometrics
- Journal of Applied Econometrics
- The Econometrics Journal
- Econometric Reviews
- User:FrLijonirappelbls/sandbox
- Template:Econometrics-journal-stub
- Foundations and Trends in Econometrics
- Quantitative Economics
- Journal of Financial Econometrics
- Naudojama en.wikiversity.org
- Naudojama es.wikipedia.org
- Naudojama eu.wikipedia.org
- Naudojama fa.wikipedia.org
- Naudojama he.wikipedia.org
- Naudojama it.wikipedia.org
- Naudojama ja.wikipedia.org
- Naudojama ko.wikipedia.org
- Naudojama ms.wikipedia.org
- Naudojama nl.wikipedia.org
- Naudojama simple.wikipedia.org
- Naudojama sr.wikipedia.org
- Naudojama tl.wikipedia.org
- Naudojama uk.wikipedia.org
- Naudojama vi.wikipedia.org
- Naudojama zh.wikipedia.org